Balance Sheet Walk-through

Robert Ellison
20 years: Capital markets & banking
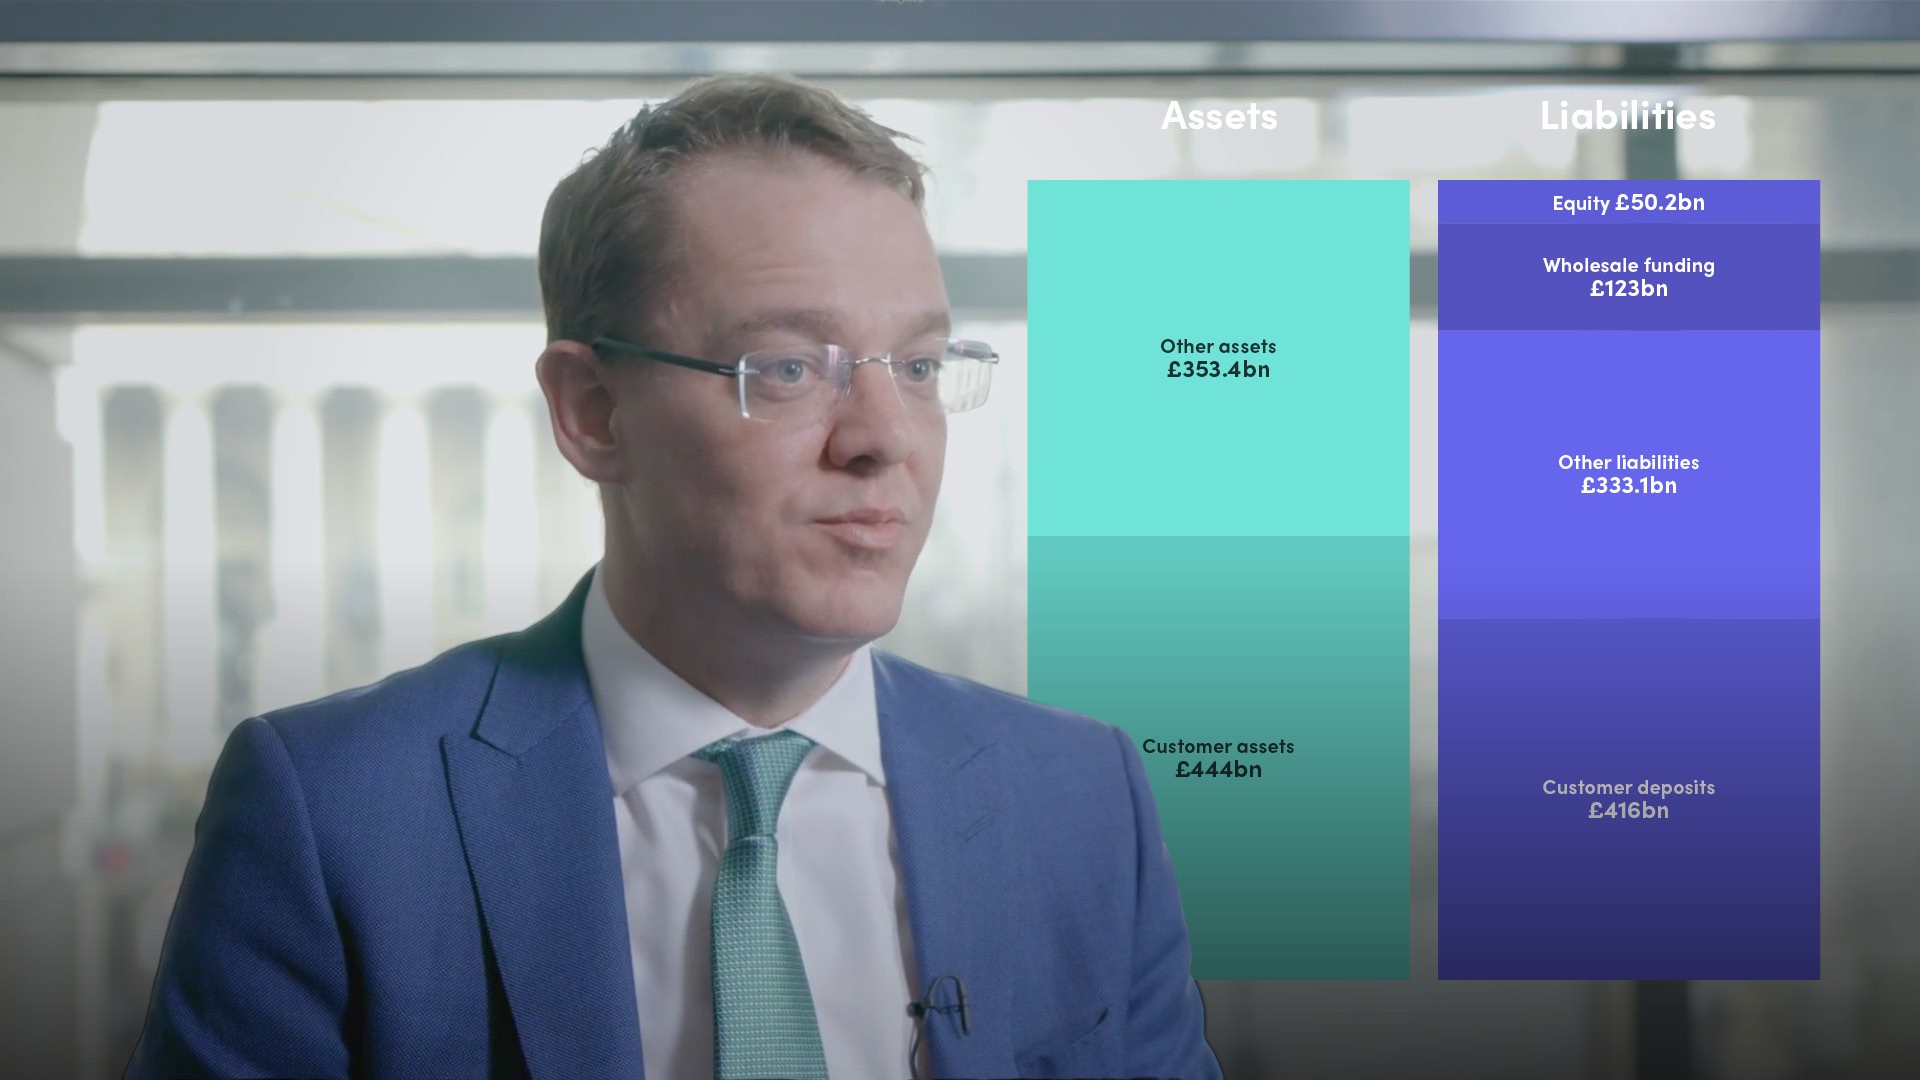
In this video, Rob walks us through Lloyds Banking Group's balance sheet. He explains the components of the financial statement and explains where they sit within the bank's assets and liabilities. He delves more deeply into the concepts discussed in 'What is a bank?' and puts some real-world figures around them.
In this video, Rob walks us through Lloyds Banking Group's balance sheet. He explains the components of the financial statement and explains where they sit within the bank's assets and liabilities. He delves more deeply into the concepts discussed in 'What is a bank?' and puts some real-world figures around them.

Balance Sheet Walk-through
20 mins 14 secs
Key learning objectives:
Define the key metrics reported on a bank’s balance sheet
Learn how assets are categorised and weighted
Identify what investors look for
Overview:
A bank’s balance sheet is the most important statement it publishes. It comes with many pages of disclosures and footnotes that report ratios for regulatory and investor purposes. The golden rule of balance sheets is it must balance: Assets = Liabilities + Equity.
Define the different metrics reported on a bank’s balance sheet, how assets are categorised and weighted and what investors look for
The Loan:Deposit Ratio
- The Loan:Deposit Ratio is customer assets divided by customer liabilities, expressed as a percentage. A ratio above 100% means that a bank has to access wholesale funding to support customer lending
Liquid assets and the Liquidity Coverage Ratio
- A bank’s High Quality Liquid Assets a.k.a liquidity must be at least as big as its modelled cash outflows over the next 30 calendar days, including in periods of extreme stress
- The Liquidity Coverage Ratio is the degree of liquidity a bank holds relative to the amount of funding that could theoretically leave the liability side of its balance sheet during 30 days of extreme stress. The regulations say it must be a minimum of 100% at all times
- This comes at a cost because assets in the liquidity portfolio tend to be very low-yielding so a large book of liquid assets represents an opportunity cost – to the detriment of Return on Equity
Shareholders Equity/Leverage ratio
- A bank’s shareholders’ equity represents the capital the bank has to protect creditors from losses
- The leverage ratio clarifies how big a bank’s equity base is relative to its asset book i.e. how well capitalised a bank is. The leverage ratio – asset exposure divided by equity capital – tells you how much capital a bank has relative to its asset base, but not how risky its asset base might be
RWAs
- The riskiness of a bank’s assets and the relativity of its capital base to the riskiness of its asset book is calculated using risk-weighted assets (RWAs). A low risk weighting (10%-20%) is assigned to low-risk assets; a high risk weighting is applied to high-risk assets, up to 100%
- RWA calculations enable banks to calculate how much capital they need to hold against each asset to protect against future losses. The higher the risk weight, the more capital that asset will need to consume
- This drives banks’ risk-based pricing models and explains why a mortgage bears a lower rate of interest than an auto loan which bears a lower rate of interest than a credit card
Core Equity Tier 1 ratio and other capital measures
- The Core Equity Tier 1 (CET1) ratio measures how much capital a bank holds in relation to its RWA. It is calculated following a number of deductions, add-ons and adjustments to both numerator and denominator so is complex
- If calculated consistently across a cohort of banks with globally co-ordinated regulation, it is a great way to compare and contrast the relative capital strength of all banks
- Equity is the most important and highest quality capital for all banks. But banks also calculate a total capital ratio, and the MREL ratio, which include other sources of capital additional to equity and which provide incremental protection to depositors. These ratios describe the size of additional capital buffers relative to a bank’s balance sheet
Return on Equity
- Bank shareholders look at the return on equity – the return a bank generates on equity investments
- RoE is the value that remains for shareholders after the bank has collected interest from debtors, collected fees and commissions and paid out the interest due to depositors and bondholders, provided for losses and operating expenses and paid its taxes
Net interest income and other income
- For banks making loans to customers and taking deposits from customers, profitability relies solely on generating a Net Interest Margin between the two
- But banks do much more than just make loans and take deposits; they provide all kinds of services to their customers
- The ‘other income’ line in a bank’s income statement can be as diverse as insurance premiums, fees relating to payments or FX services, or trading income. Some banks refer to the Other Income line as Other Operating Income, or OOI

Robert Ellison
There are no available Videos from "Robert Ellison"

