Business Cycles and the Yield Curve

Kent Matthews
35 years: Professor in economics & finance
In this video, Kent covers the various yield curve shapes and how these can be explained. Kent also explains the bank rate, and how changes in this can affect the economy.

In this video, Kent covers the various yield curve shapes and how these can be explained. Kent also explains the bank rate, and how changes in this can affect the economy.
Business Cycles and the Yield Curve
11 mins 7 secs
Key learning objectives:
What is the yield curve?
The theories that explain the curve
The implications of the yield curve
Overview:
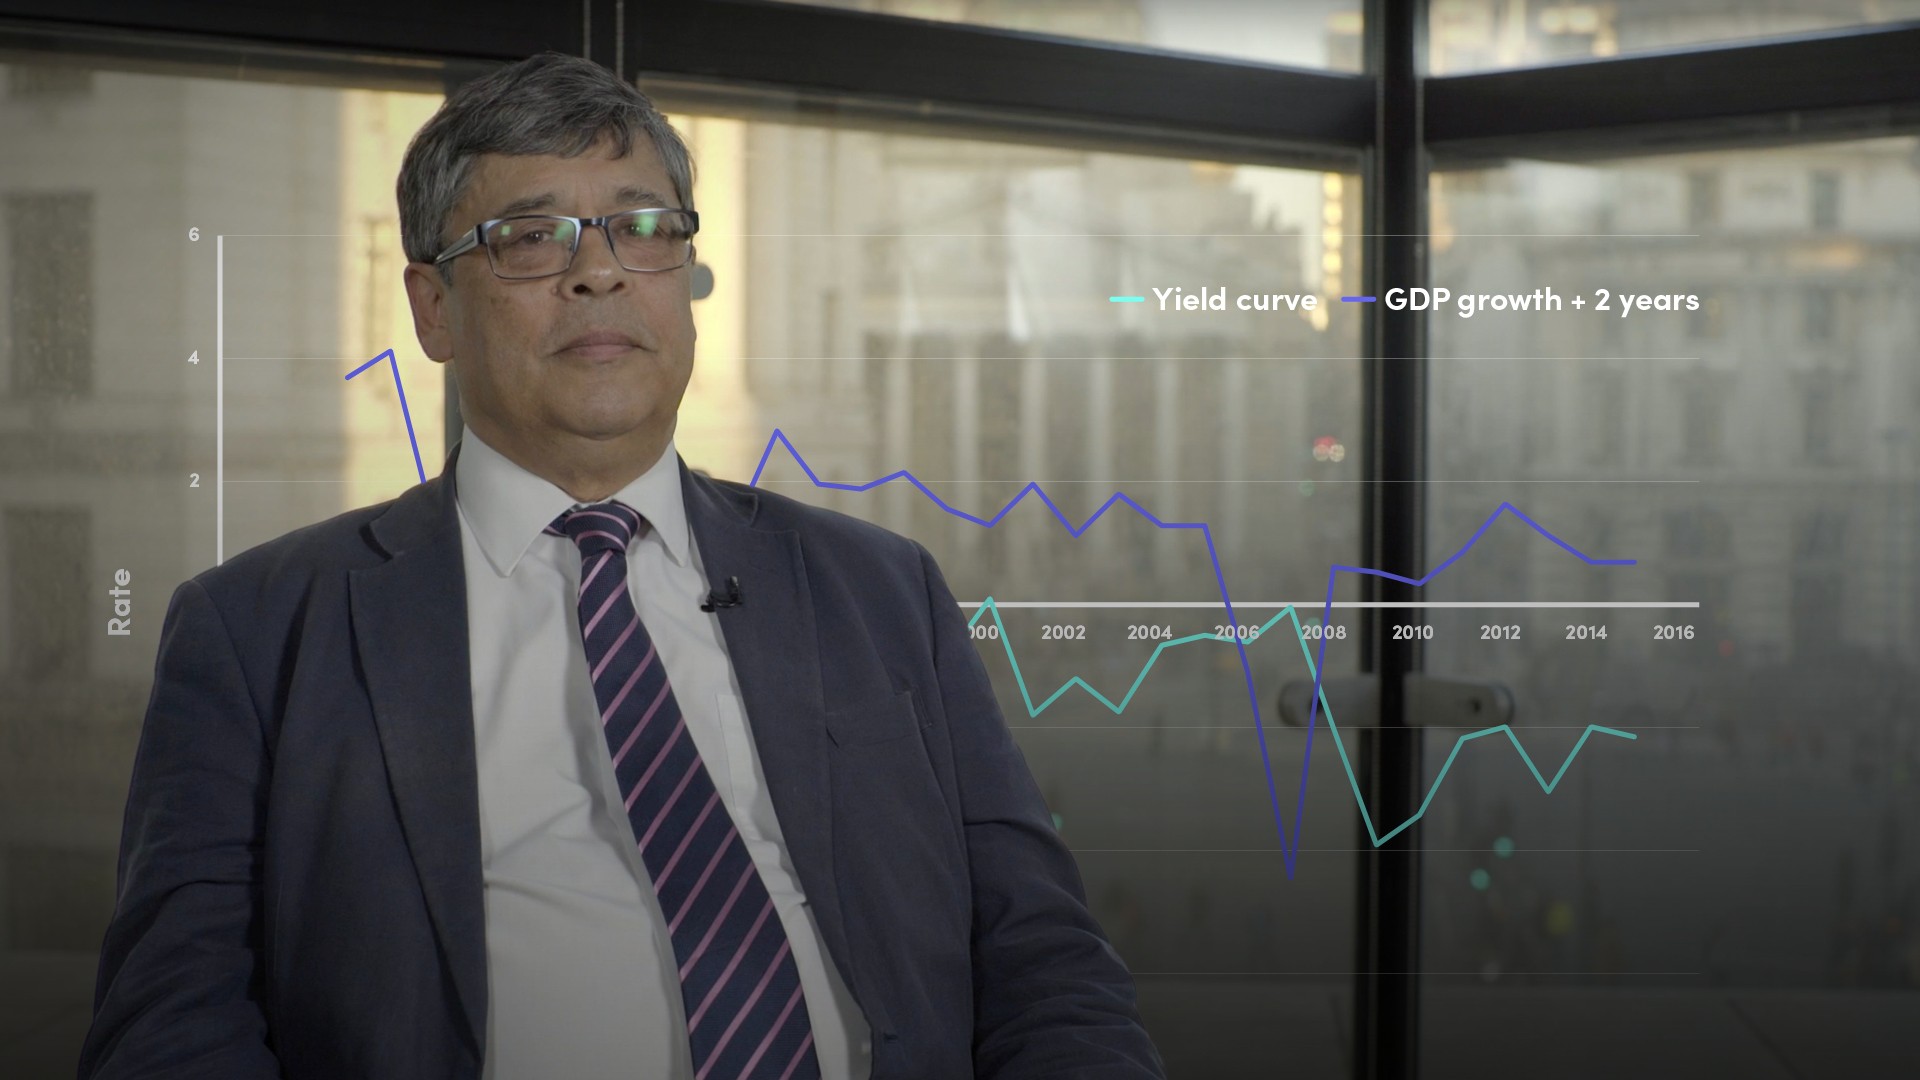
The yield curve, the relationship between bond yields and maturities can be used to describe the current and future state of the economy. The yield curve depicts times of normal economic activity and can be used to predict an impending recession.
What can the Yield Curve Tell us about the Business Cycle?
There are two issues here. The first is whether financial markets can tell us something about the future business cycle. The second is whether financial markets can tell us something about the state of the economy today. Expectations about the future affect behaviour today in financial markets. Expectations about a weakening economy will see a depreciation of the exchange rate and investors sell sterling on the hope of buying it back at a cheaper rate in the future. But the very act of selling causes a depreciation. Similarly, investors sell sterling financial assets because they think the value of sterling will fall when the economy weakens. The act of selling causes asset prices to fall and the implied yield on interest rate on those assets to rise.
What is the Yield Curve & Bank Rate?
The yield curve plots the yields on financial assets of different maturities and common risk rating. Because different financial assets have different maturities and different risk maturities, we typically use British government bonds of different maturities to give a common risk characteristic for all bonds. The yield is basically the annual coupon payment divided by the value of the bond. The Bank of England, through the Monetary Policy Committee conducts monetary policy by varying the Bank rate. The Bank rate is the rate of interest at which the Bank of England lends funds to the commercial banks.
What Explains the Shape of the Yield Curve?
Pure expectations theory - Since British government bonds have the same risk characteristics, there is no risk premium associated with different maturities of bonds. Then investors will be indifferent, which means there will be an equivalence between holding a 5-year bond or a 1-year bond rolled over for 5 years on each year of its redemption. But if investors expect interest rates to rise, then after each year at the redemption date they will expect the rate of interest on 1-year bonds to be higher than in the previous year. Since they are indifferent between the two types of bonds, the 5-year bond will have a higher interest rate than the 1-year bond. Investors might expect inflation to rise in the future. Since investors are interested in the real return on their assets that is the yield minus inflation, then if they expect inflation to rise they will expect interest rates to rise to compensate.
Liquidity premium theory - Investors demand a higher yield on longer maturity bonds because their money is tied up for longer. If they needed to sell to meet a liquidity need, they might have to sell at a lower price than they bought if interest rates rose and therefore face a capital loss. If investors expect interest rates to rise in the future, they expect to make a capital loss if they need to sell before redemption and therefore demand a higher rate of interest now to compensate them in the form of a liquidity premium.
The MPC uses the Bank rate to control the inflation rate which is set at a target of 2% a year. When the economy is rising above its full capacity, the economy is overheating, and inflation will rise. The MPC raises the Bank rate to increase the cost of borrowing and cool the economy down. When the economy is below its full capacity, inflation will fall and the MPC lowers Bank rate to stimulate the economy.
What is the Inverted Yield Curve, and what does it tell us?
The normal shape of the yield curve is upward sloping. An inverted yield curve is when Bank rate and other short-term interest rates are above the long-term interest rate. That is, when the yield curve is downward sloping. It is often suggested that when this occurs, the financial markets are signalling a recession. Indeed, there is plenty of empirical evidence to support this assertion. However, it is not always the case.

Kent Matthews
There are no available Videos from "Kent Matthews"