Introduction to the Monte Carlo Simulation

Abdulla Javeri
30 years: Financial markets trader
Abdulla explains the significance of the Monte Carlo Simulation: what it tries to achieve and how it works. In so doing, Abdulla provides an example using an excel spreadsheet.

Abdulla explains the significance of the Monte Carlo Simulation: what it tries to achieve and how it works. In so doing, Abdulla provides an example using an excel spreadsheet.
Introduction to the Monte Carlo Simulation
4 mins 52 secs
Key learning objectives:
Describe the Monte Carlo Simulation
Outline some of its uses in financial markets
Understand how the simulation works in practice
Overview:
The Monte Carlo Simulation is a technique used to stimulate potential changes to a value, a price, or any number, usually over a number of time periods. It has a wide variety of applications, some of which include: stock prices and inflation rates.
What is the Monte Carlo Simulation?
- A method used to stimulate a unique path for potential changes to a number
- Based on a random pick from an assumed probability distributed with a mean and standard deviation
- When repeated numerous times it defines the probability distribution of the final outcomes
Under which conditions can the simulation be used?
Essentially it can be used in any area where numbers are subject to change, but where the change is not perfectly predictable, or is subject to some randomness in its movement.What are some of its uses in financial markets?
- Valuation of certain types of options
- Potential changes to the price of assets over time
- In the measurement and management of risk
What does the Monte Carlo method require?
- An average for the expected change
- A standard deviation/volatility
How does the simulation work in practice?
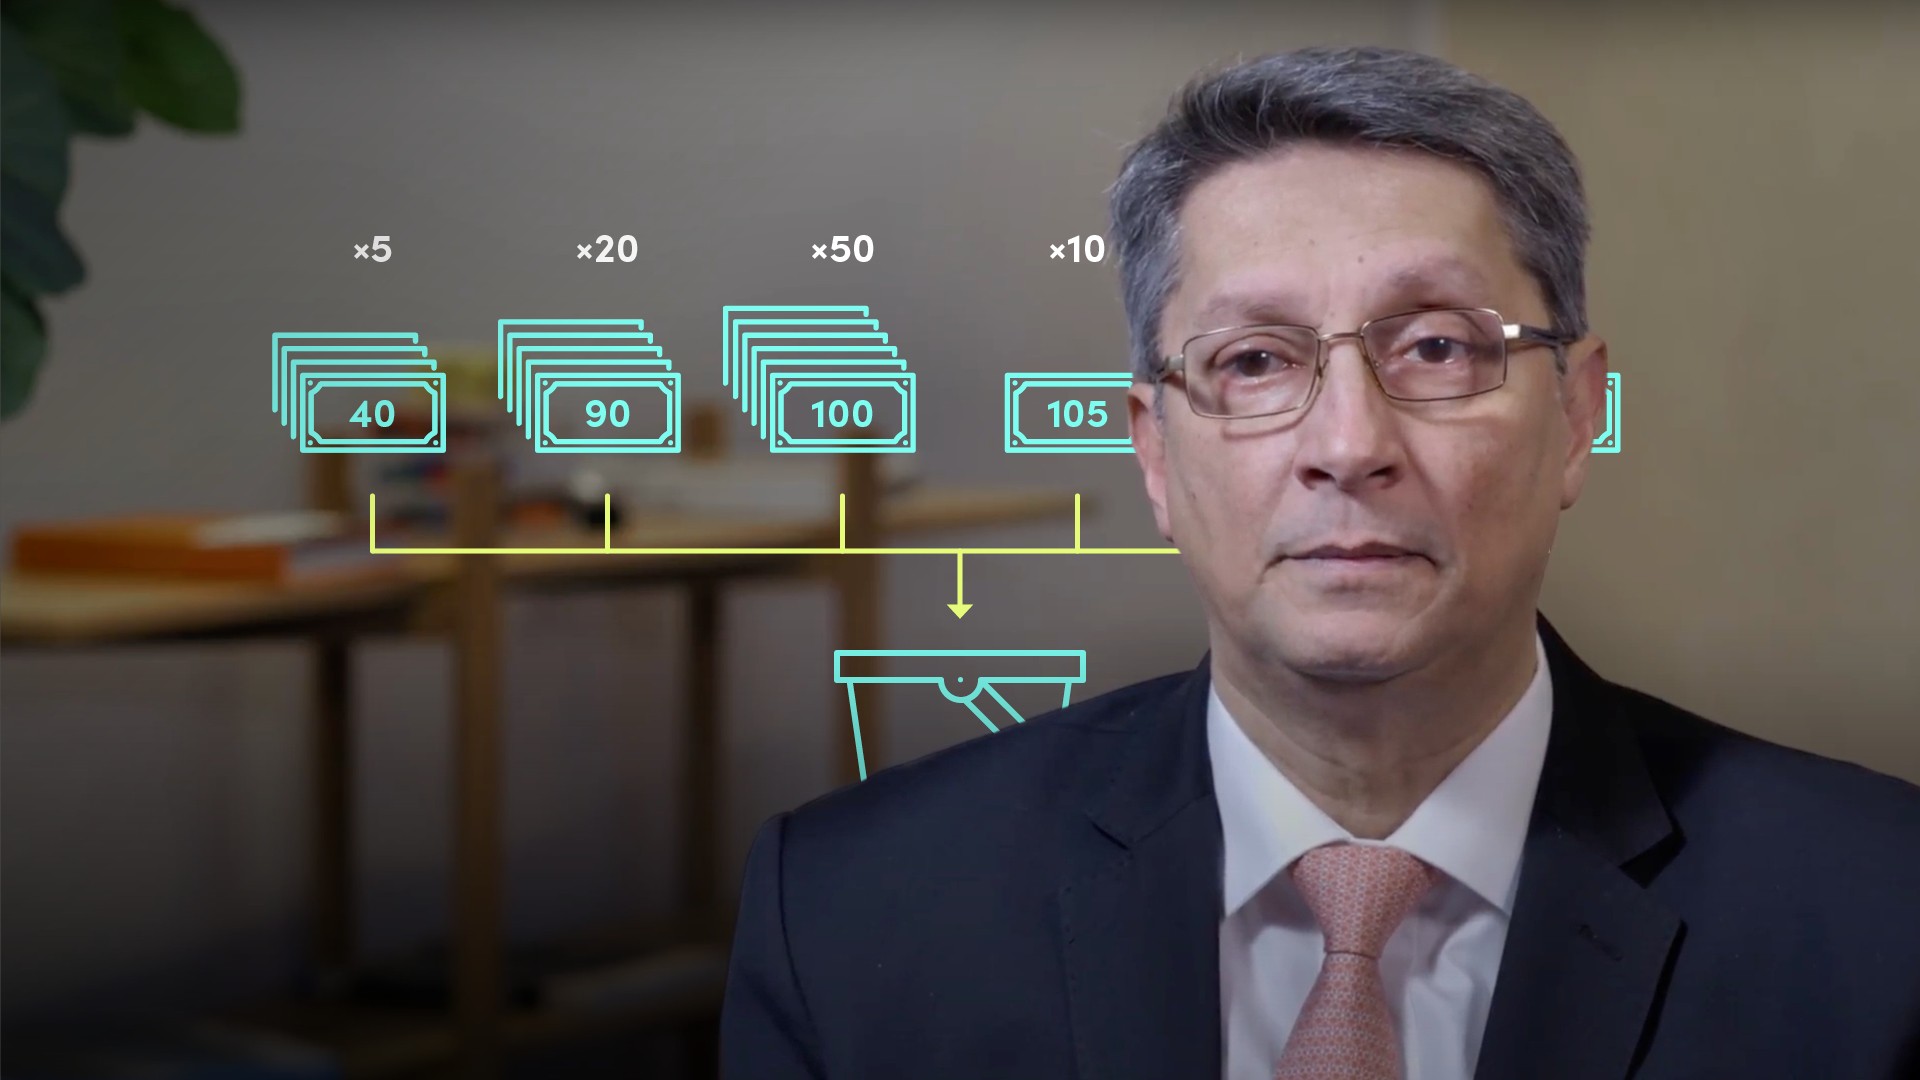
- Today’s value = 100. We want to know what the number could potentially be tomorrow: let's assume that tomorrow we expect the number to remain unchanged, but subject to some variability. Assume that it could be any of the numbers in the figure below - The probabilities associated with those numbers are also shown:


Abdulla Javeri
There are no available Videos from "Abdulla Javeri"