Normal vs Lognormal Distributions

Abdulla Javeri
30 years: Financial markets trader
In previous videos, Abdulla outlined the basic features of normal and lognormal distributions and their essential characteristics. In this video, Abdulla clarifies those differences in graphical form.
In previous videos, Abdulla outlined the basic features of normal and lognormal distributions and their essential characteristics. In this video, Abdulla clarifies those differences in graphical form.

Normal vs Lognormal Distributions
3 mins 58 secs
Key learning objectives:
Briefly outline the difference between normal and lognormal distributions
Overview:
The video demonstrates a quick outline of the differences between normal and lognormal. The differences show up primarily through the shape of the curve given which figure is used on the x-axis.
What is the difference between normal and lognormal distributions?
We already know that in a normal distribution the numbers on the x axis are likely to be prices, percentage returns or indeed natural logs. They’re all normally distributed resulting in the bell shaped curve in each case. Because we’re using different units on the x axis, the differences don’t show up. To see them clearly, we’ll fix the x axis with a price scale and superimpose the probabilities associated with those prices using the two distributions.
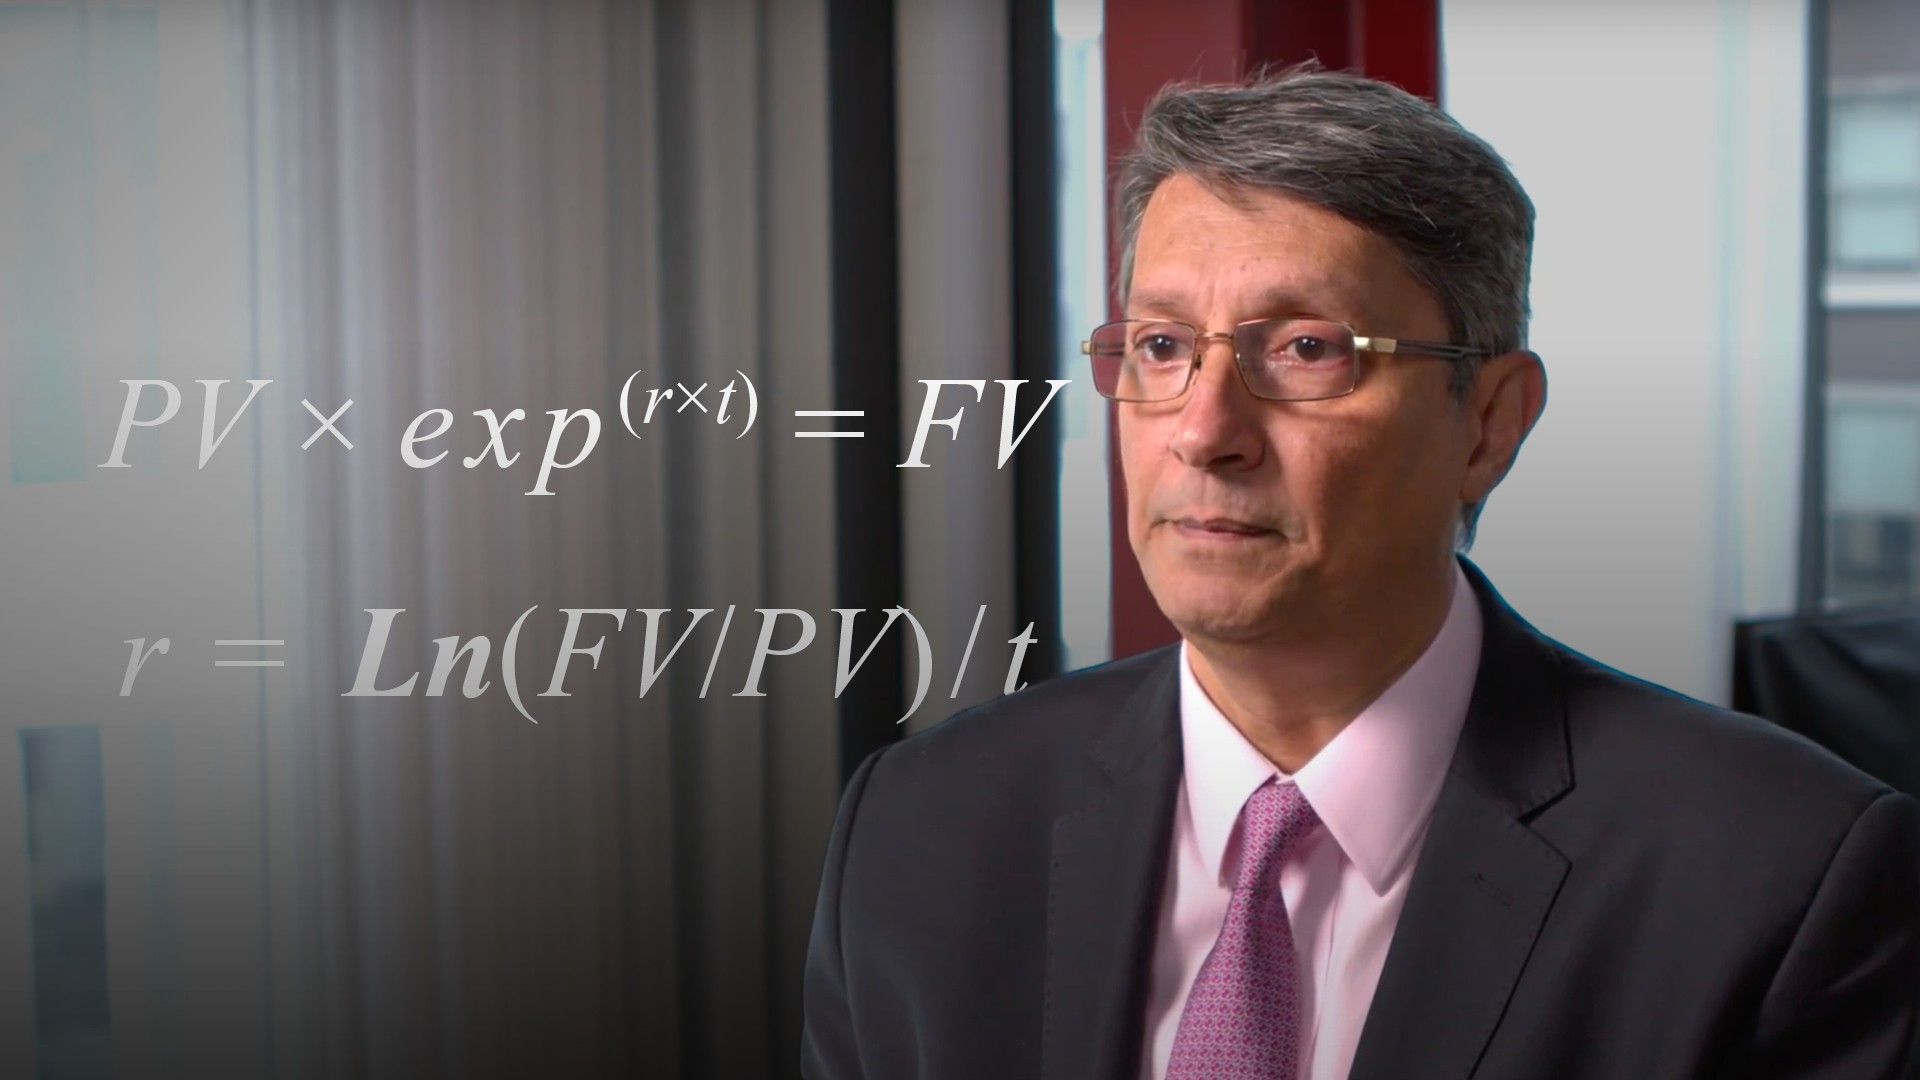
Over to the lognormal distribution. In the log column we’ll convert the price into what is often referred to as a log return. Recall that we can think of the natural log as a continuous rate of return. In other words at what continuous rate would we need to compound or discount to get from the mean to any price interval.
To conclude. If prices are normally distributed we get the standard bell shaped curve. In a lognormal distribution, the curve will be bell shaped if logs are used on the x axis, but using a price scale, the distribution is positively skewed with a lower bound of zero.

Abdulla Javeri
There are no available Videos from "Abdulla Javeri"

