Scientific Evidence of Climate Change

Kevin Trenberth
Former Coordinating Lead Author of the IPCC
In this video, Kevin explains how global warming has been observed and measured from a scientific perspective. He looks at rising global temperatures caused by increased CO2 levels and how Earth’s energy imbalance has risen over time. He then explains how global warming has been observed through rising ocean temperatures and sea levels, as well as through changes in the land and the ice.

In this video, Kevin explains how global warming has been observed and measured from a scientific perspective. He looks at rising global temperatures caused by increased CO2 levels and how Earth’s energy imbalance has risen over time. He then explains how global warming has been observed through rising ocean temperatures and sea levels, as well as through changes in the land and the ice.
Scientific Evidence of Climate Change
21 mins 56 secs
Key learning objectives:
Outline how global temperatures, Earth’s energy imbalance and CO2 levels have risen
Outline how global warming has been observed through changes in the oceans, land and ice
Overview:
The observational evidence proving global warming is mounting and extremely visible. Every year seems to be record-breaking, with the ocean found to be at its warmest state ever. Land and sea ice is melting, and heatwaves and wildfires are a consequence on land. Ironically, both droughts and heavy rains, with their associated flooding risk, are increasing too. Carbon dioxide levels are at all time highs, the energy imbalance is rising, seas are warming and rising, and there has been significant changes in the land and ice.
How have global temperatures and CO2 levels changed?
An analysis of surface 2m air temperatures from 1979 - 2018 shows the average temperatures of the seasons. The annual average is 12.84°C, the January value is 10.92°C, April is 12.81°C, July is highest at 14.70°C, and October is 12.92°C.
The joint warmest years on record according to NOAA are 2016 and 2020. 2016 was a large El Niño year, however, rather concerningly 2020 was not. El Niño years tend to be warmer because of warm surface waters in the central and eastern tropical Pacific.
Between 1999 and 2013 there was little or no increase in GMST, a period known as the ‘hiatus’. However, 2014 was the warmest year on record after that, and now the 7 warmest years on record are the last seven years. Global warming is clearly evident.
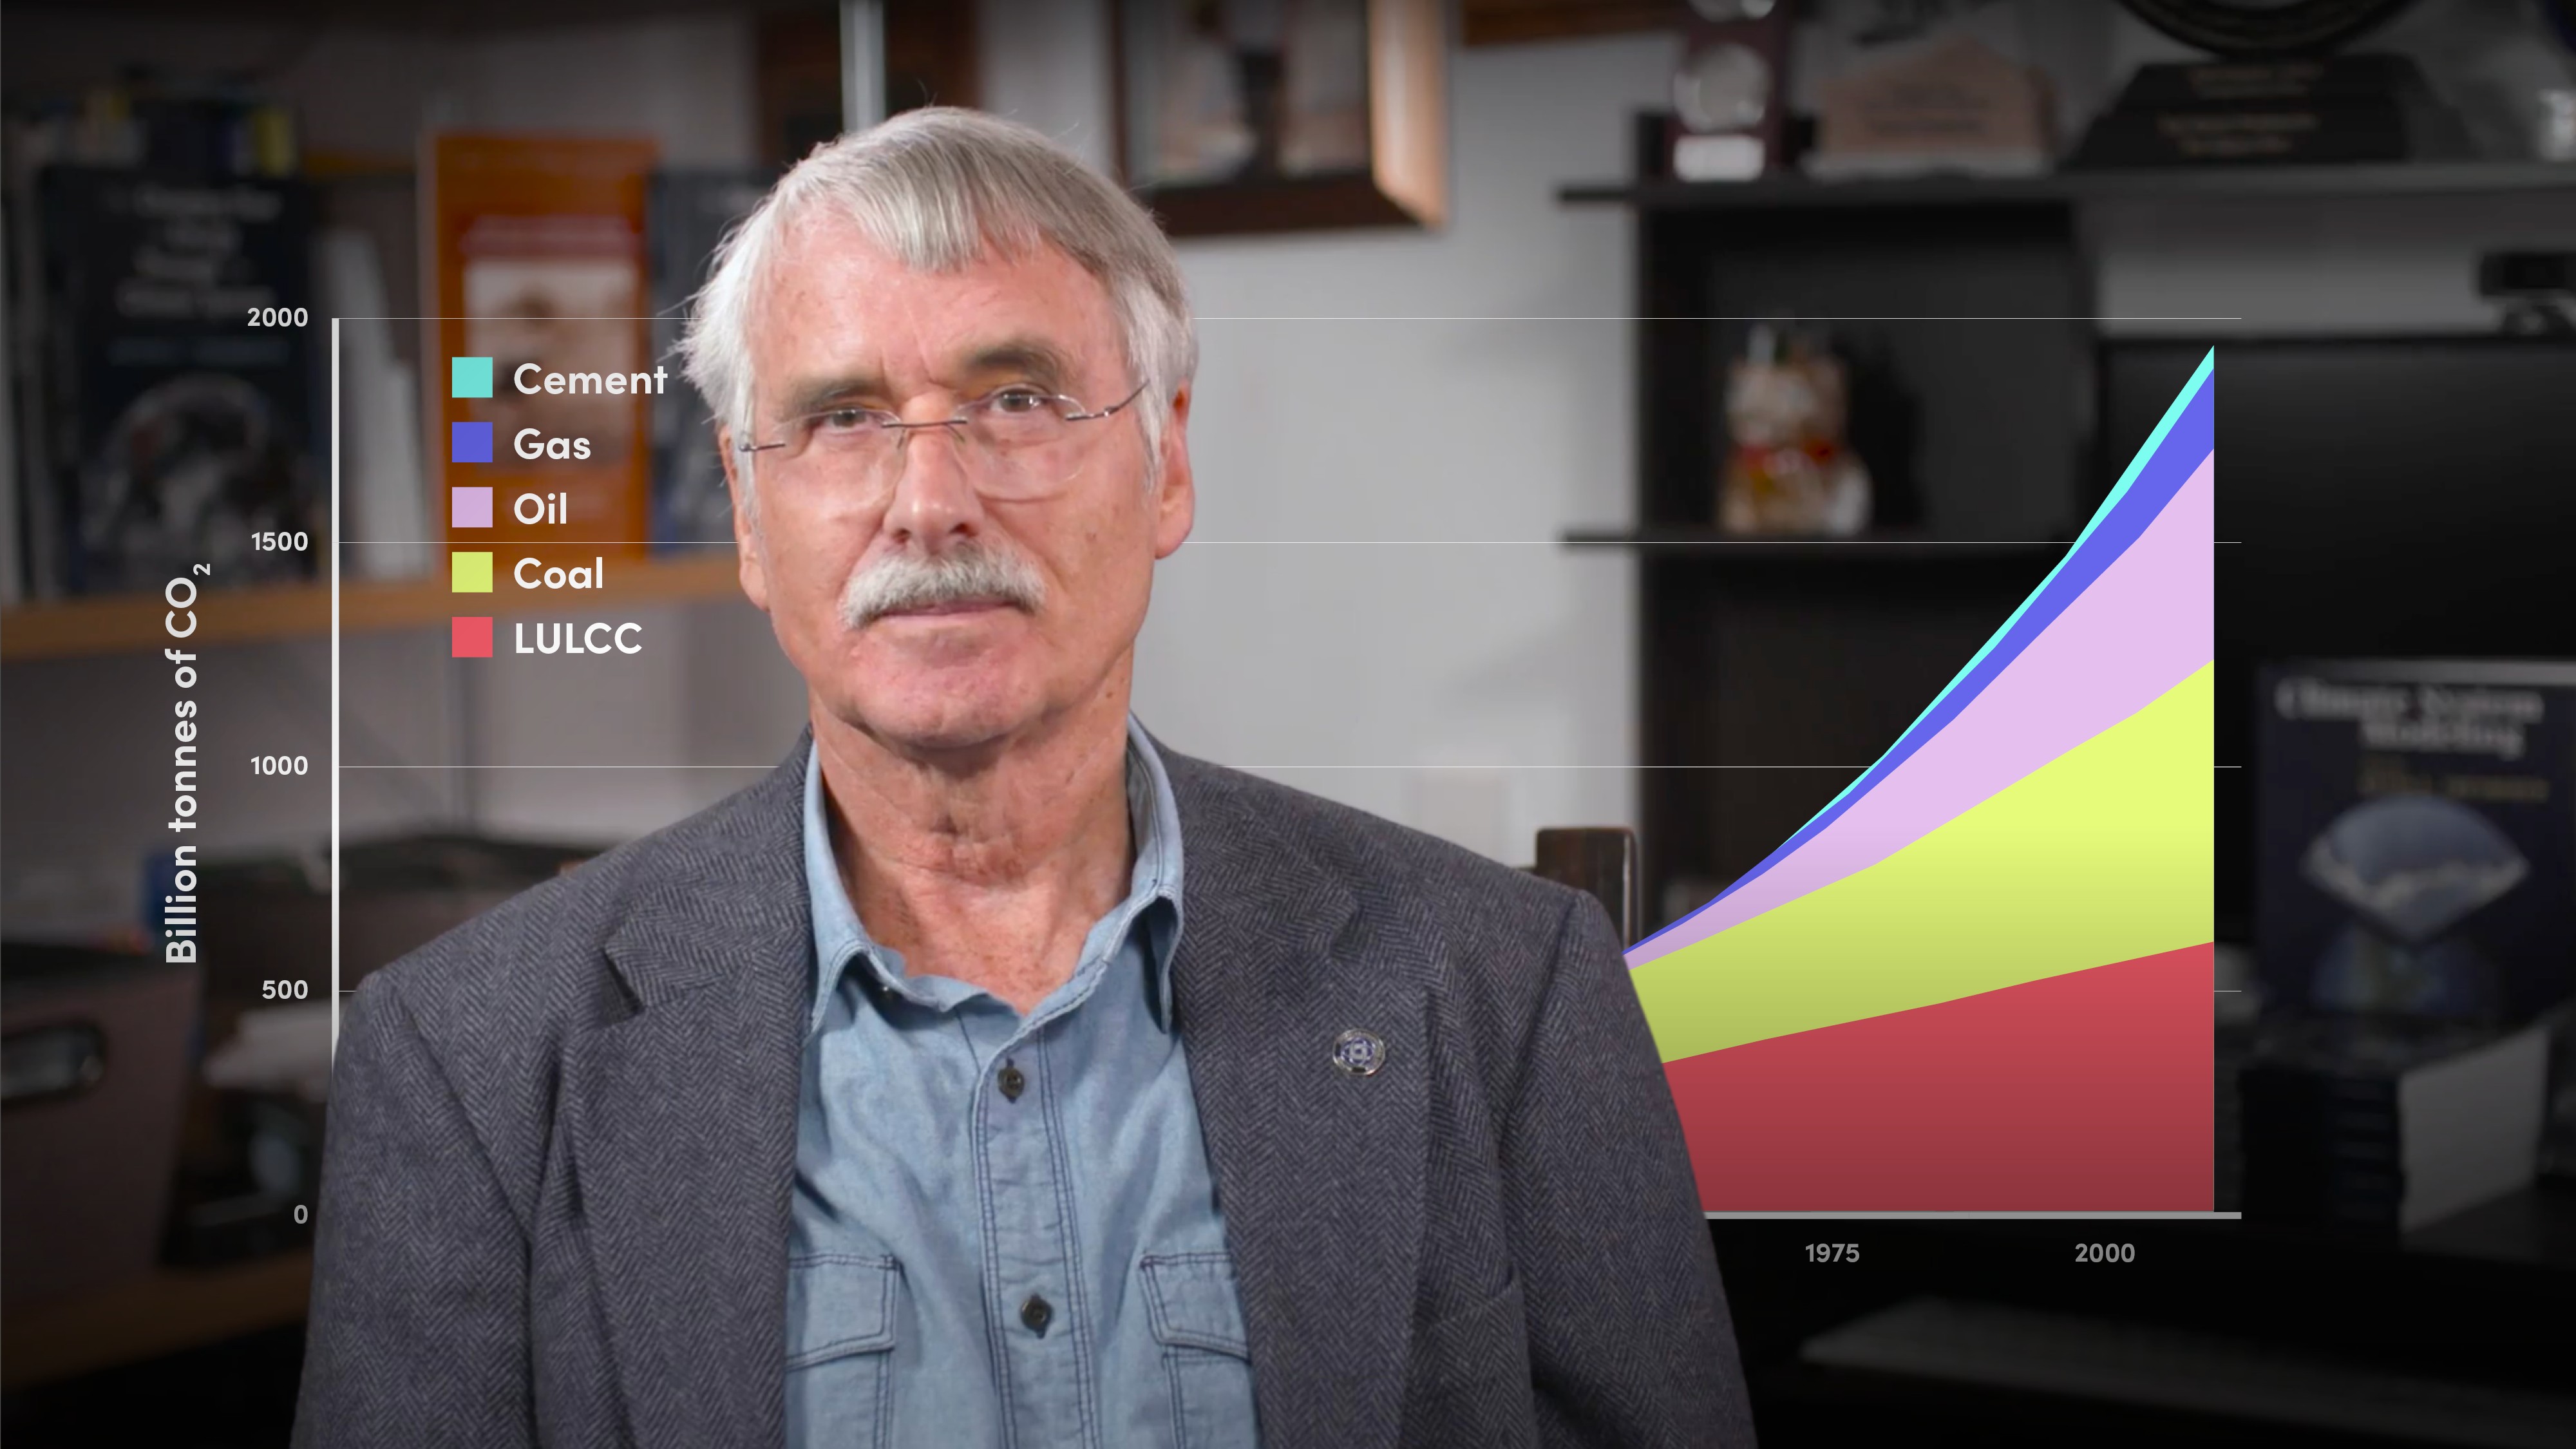
Carbon dioxide levels are now at over 415 parts per million, this is a 48% increase since 1985. Excess carbon dioxide and other greenhouse gases are what cause global warming, through trapping the energy from the sun.
Has Earth’s energy imbalance always been constant?
The EEI is a fundamental metric of climate change, and the local distribution of the imbalance has implications for regional climate variations. It has been difficult to accurately assess EEI because the values are very small compared with the natural flows of energy through the climate system, but since they are always positive, the effects accumulate.
The EEI is the difference between the amount of incoming net absorbed shortwave (solar) radiation (ASR) and outgoing longwave (thermal) radiation (OLR). An instrument called CERES has measured incoming and escaping radiation since 2000, they have assigned an average of 0.9 watts per square metre from 2005 - 2019. There is however large month-to-month variability in EEI. The trend is increasing however, with an EEI of 1.2 watts per square metre over the past 5 years.
How has climate change been observed in the oceans, the land and ice?
The main place excess energy (heat) is stored is in the oceans. Therefore the ocean heat content is relentlessly increasing. Similar to surface temperatures, the last 5 years have also been the warmest years on record for the oceans. Because of this, the oceans are experiencing more frequent marine heatwaves which leave a trail of destruction for marine life in their wake.
Rising temperatures are causing sea levels to rise but they are also rising due to melting ice. Sea levels have risen by 80mm since observations began in 1992. Estimates suggest that global mean sea levels have risen about 210-240 mm since 1880.
The main method of assessing land warming is through borehole temperatures, however they are heavily biassed as to where they are located. Based upon borehole temperature changes, in the late 20th century the rate of warming of the land after 1950 was estimated to be of order 6 TW. This has no doubt increased since the turn of the century. Several estimates of heat uptake into land, based partly on models, put the values at 6–7 TW, increasing to perhaps 10–12 TW after 2000.
The loss of ice is one of the most visible aspects of climate change. Arctic sea ice extent has fallen 45% since 1979 and there is widespread evidence of retreating glaciers on land around the world. The ice sheets of Greenland and Antarctica are also melting.
Kevin Trenberth
There are no available Videos from "Kevin Trenberth"